上週軟體專案管理實務課程,第五組的炯佑同學特別上網找了有關於Earned Value Management的一些公式。肥蝦此處只是將PMBOK 2008上的有關公式整理一下,並且對於課堂上所舉出解釋EVM的圖形提出自己的看法;另外對於此次新加入的EAC預測計算式,也提出肥蝦的初步構想。
(1)PMBOK 2008計算公式
| Performance Measurement Analysis | |||
| Term Name | Short Name | Definition | Formula |
| Planned Value | PV | PV is the budgeted cost for the work scheduled to be completed on an activity or WBS component up to a given point in time. |
|
| Earned Value | EV | EV is the budgeted amount for the work actually completed on the schedule activity or WBS component during a given time period. |
|
| Actual Cost | AC | AC is the total cost incurred in accomplished work on the schedule activity or WBS component during a given time period. |
|
| Budget at Completion | BAC |
|
|
| Cost Variance | CV |
| CV=EV-AC |
| Schedule Variance | SV |
| SV=EV-PV |
| Cost Performance Index | CPI |
| CPI=EV/AC |
| Cumulative Cost Performance Index | CPIC | The cumulative cost performance index is widely used to forcast project costs at completion. CPIC equals the sum of the periodic earned value (EVC) divided by the sum of the individual actual costs(ACC) | CPIC=EVC/ACC |
| Schedule Performance Index | SPI |
| SPI=EV/PV |
| Forcasting | ||
| Term Name | Short Name | Formula |
| Estimate to Complete | ETC | |
| Estimate at Completion | EAC | |
| | | |
| ETC using a new estimate | | ETC=ETCnew |
| ETC based on atypical variances | | ETC=(BAC-EVC) |
| ETC based on typical variances | | ETC=(BAC-EVC)/CPIC |
| To-Complete Performance Index based on the BAC | TCPIBAC | TCPIBAC =(BAC-EV)/(BAC-AC) |
| To-Complete Performance Index based on the EAC | TCPIEAC | TCPIEAC =(BAC-EV)/(EAC-AC) |
| | | |
| EAC using a new estimate | | EAC=ACC+ETC |
| EAC using remaining budget | | EAC=ACC+(BAC-EV) |
| EAC using CPIC | | EAC=ACC+((BAC-EV)/CPIC) |
| EAC forecast for ETC work considering both SPI and CPI factors | | EAC=ACC+[(BAC-EV)/(CPIC*SPIC)] |
上表預測計算式中的(i)To-Complete Performance Index based on the BAC。(ii)To-Complete Performance Index based on the EAC。(iii)EAC forecast for ETC work considering both SPI and CPI factors為新增的計算式。而課本上所載的BCWS(計畫進度之預估成本)即為PV;BCWP(實際進度之預估成本)則為EV;ACWP(實際進度的實際成本)即是AC。
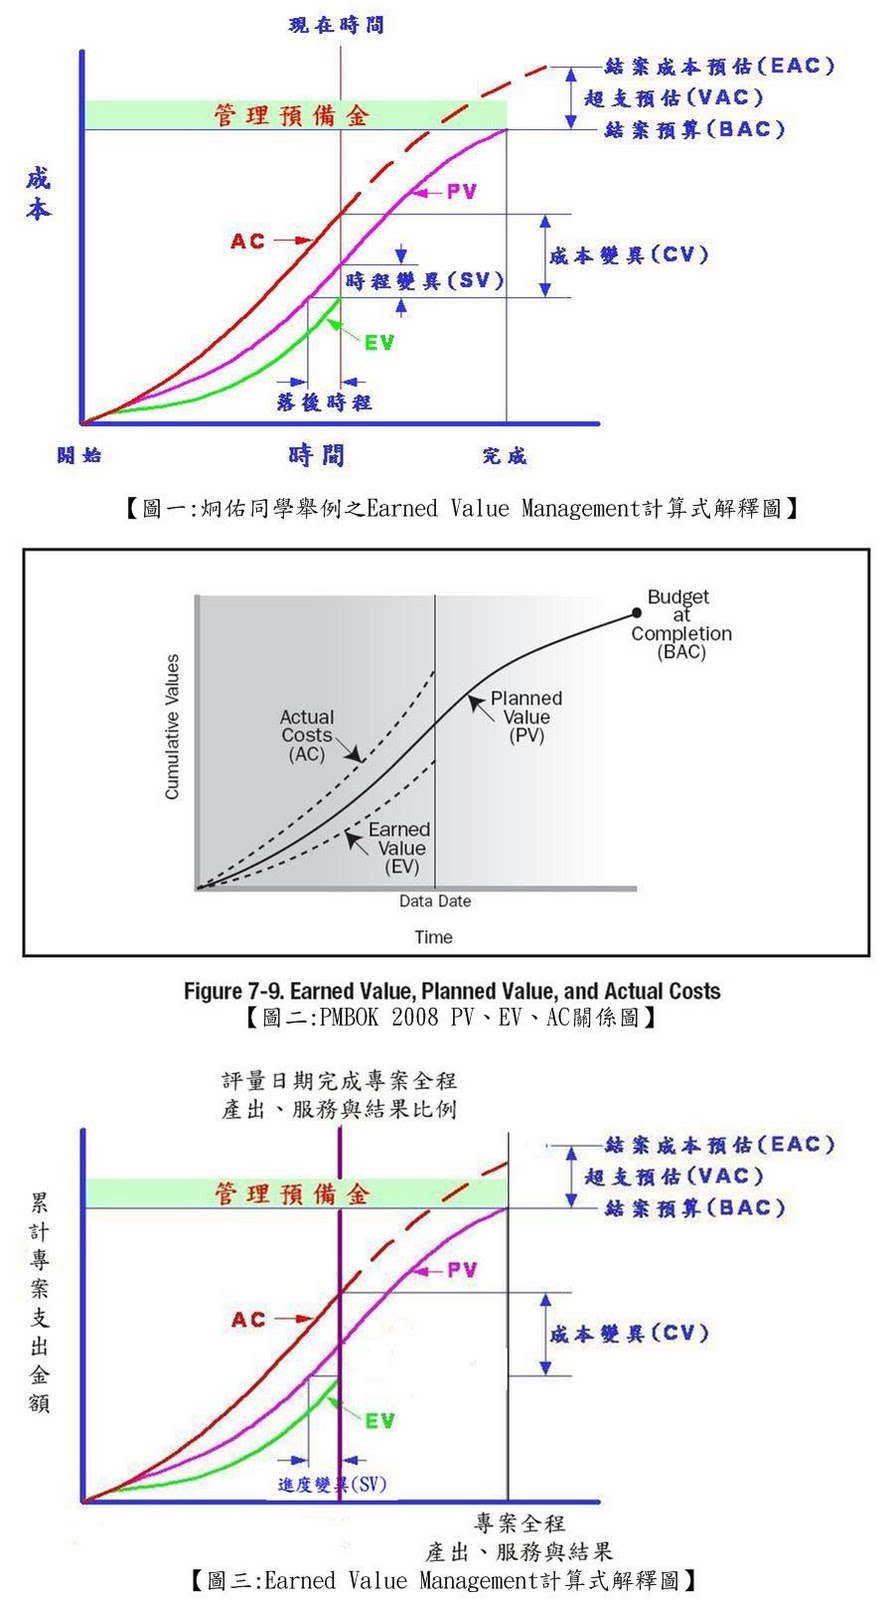
炯佑同學課堂上所提供Earned Value Management計算式的解釋圖形如【圖一:炯佑同學舉例之Earned Value Management計算式解釋圖】所示。
這為一般網路上或一般書籍中常用的圖形。而在PMBOK 2008比較EV、AC與PV的圖形則如【圖二:PMBOK 2008 PV、EV、AC關係圖】。
對於EAC的曲線並未如炯佑同學所示的加以繪出,這原因何在?就肥蝦的理解的主因為:這些計算值都已經轉換為用金錢來衡量,而所謂的計畫進度或者實際進度,並不是指工期而言,而是專案範圍所規劃出專案期間或結案之時所要交付的產出、服務或結果中完成的百分比。因此【圖一】應該修正為如【圖三:Earned Value Management計算式解釋圖】所示。
(3)對於新增計算式的疑問與想法
(I)公式:EAC=ACC+[(BAC-EV)/(CPIC*SPIC)]
(II)PMBOK的說明:
將尚未完成的專案百分比經由CPIC與SPIC加以調整,以期有效反應專案可能的實際狀況。
(III)肥蝦的看法:
肥蝦以為用指數的好處是不會把符合原規劃進度(剛好等於一)的因子誇大,也不會產生CPI與SPI之間有『線性』比例的互抵關係。指數是就各因子本身加重計算,指數的數字可不是CPI/SPI為20/80就把SPI^4,肥蝦將80/50(原先佔一半現佔0.8=>0.8/0.5=1.6)SPI^1.6。以下舉例說明:
舉例:CPI/SPI為1.2與0.8
(1)50/50
(i)CPI*SPI=0.96
表示CPI與SPI間沒有完全抵銷的作用,會加重DELAY的因子。
(ii)0.5*1.2+0.5*0.8=0.6+0.4=1
表示CPI與SPI間有完全抵銷的作用(就表示CPI多的0.2*(50/50)=0.2可以增強SPI原本只有的0.8的狀況)。
(iii)CPI^1*SPI^1=0.96
同CPI*SPI。
(2)20/80
(i)0.2*1.2+0.8*0.8=0.24+0.64=0.88
就表示CPI多的0.2*(80/20)=0.8可以增強SPI原本只有的0.8的狀況。
1.2^1*0.8^(1.6)=1.2*0.7=0.84
(3)80/20
0.8*1.2+0.2*0.8=0.96+0.16=1.12
(i)就表示SPI少的0.2*(80/20)=0.8可以弱化CPI原本1.2到1.12
1.2^(1.6)*0.8^(1)=1.071
因此兩者權重百分比,肥蝦把其轉成各自因子加重的比重,以上也只是肥蝦的初步想法而已!
沒有留言:
張貼留言